Integrating Thermometer Temperature Icons into Visual Workflows and Data Communication
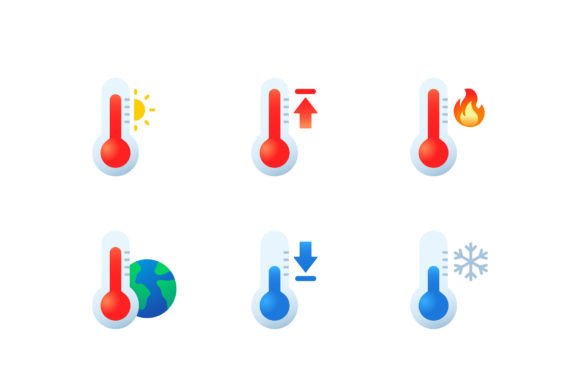
In the landscape of digital design and information architecture, visual shorthand is essential for reducing cognitive load. Thermometer temperature icons serve as a universal metaphor for intensity, status, health, and environmental conditions. For professionals ranging from UX designers to project managers, these symbols are more than mere decoration; they are functional interface elements that communicate quantitative data instantly. Understanding how to deploy thermometer temperature icons effectively requires moving beyond basic clip art selection and treating them as integral components of a broader communication strategy.
The primary function of a thermometer icon is to translate abstract numerical values into immediate visual comprehension. In user interfaces, dashboards, and marketing materials, this translation bridges the gap between raw data and human perception. Whether indicating server load, weather conditions, customer satisfaction scores, or sales performance, the vertical or horizontal fill of a thermometer provides an intuitive gauge of "how much" or "how hot" a situation is without requiring the user to read specific digits first. This pre-attentive processing makes thermometer temperature icons invaluable in workflows where speed and clarity are paramount.
Strategic Application Across Project Phases
The utility of thermometer temperature icons extends across the entire lifecycle of a product or campaign. Their application shifts depending on whether you are in the planning, execution, or reporting phase of a workflow. Recognizing these distinct use cases ensures the asset serves a purpose rather than simply filling space.
Planning and Wireframing
During the initial stages of app development or dashboard design, thermometer icons act as placeholders for complex logic. When wireframing a system monitoring tool, placing a thermometer symbol signals to developers and stakeholders that a specific metric requires a gradient-based visualization rather than a binary state. This early integration helps define the data requirements before a single line of code is written. It forces the team to ask critical questions: What constitutes "normal" versus "critical"? Does the scale need to be linear or logarithmic? By establishing the icon’s presence early, teams can align on the thresholds that will eventually drive the visual state.
Active Monitoring and User Interaction
In live environments, such as SaaS platforms or IoT control panels, thermometer temperature icons function as real-time feedback mechanisms. Here, the icon is often dynamic, changing color or fill level based on streaming data. For creators building educational content or gamified learning modules, these icons provide instant progress tracking. A rising thermometer can indicate increasing difficulty or engagement levels, offering users a sense of momentum. In e-commerce, a "hot deal" thermometer creates urgency by visually representing inventory depletion or time sensitivity. The key during this phase is responsiveness; the icon must update smoothly to maintain trust and usability.
Post-Project Analysis and Reporting
After a campaign or sprint concludes, thermometer temperature icons help summarize outcomes in presentations and case studies. Stakeholders often skim reports before diving into details. A well-designed summary slide using thermometer metaphors allows executives to grasp performance health at a glance. For example, a set of three thermometers representing budget, timeline, and quality can quickly show that while the project was under budget (cool), it ran over schedule (hot). This visual storytelling enhances the narrative of post-mortem analyses, making retrospective meetings more productive and focused on actionable insights rather than data deciphering.
Integration with Design Systems and Technical Assets
Thermometer temperature icons do not exist in isolation. They must interact seamlessly with typography, color palettes, grid systems, and accessibility standards. Treating them as standalone images leads to inconsistent experiences and technical debt. Successful integration requires a systematic approach to asset management.
Vector Scalability and Format Consistency: Always utilize SVG formats for thermometer icons in digital products. Rasterized PNGs lose crispness on high-DPI displays and fail to respond to CSS styling. Vector assets allow developers to animate the fill level programmatically and adjust stroke weights to match surrounding UI elements. When building a design library, ensure your thermometer icons share the same optical weight, corner radius, and cap style as other icons in the set. A rounded, playful thermometer looks out of place next to sharp, technical navigation icons, disrupting the visual hierarchy.
Color Semantics and Accessibility: The most common pitfall with thermometer icons is relying solely on color to convey meaning. While red universally suggests heat or danger, and blue suggests cold or safety, colorblind users may not distinguish these states. Effective implementation pairs color changes with secondary indicators. Consider adding tick marks, percentage labels, or distinct icons inside the thermometer bulb to reinforce the state. Furthermore, ensure sufficient contrast ratios between the fill color and the background. In dark mode interfaces, neon fills may require desaturation to prevent eye strain while maintaining legibility.
Data Binding and Dynamic States: For developers and no-code builders, integrating thermometer icons involves mapping data ranges to visual states. Define clear breakpoints in your configuration. If a thermometer represents CPU usage, determine exactly when it transitions from green to yellow to red. Hardcoding these values leads to maintenance nightmares. Instead, use design tokens or CSS variables to manage threshold colors globally. This allows you to update the warning temperature across an entire platform by changing a single variable, ensuring consistency and reducing quality control overhead.
Workflow Efficiency and Quality Control
Incorporating thermometer temperature icons efficiently requires preparation and standardized processes. Freelancers and agency teams benefit from creating reusable components that encapsulate both the visual asset and its behavioral logic. This reduces repetitive work and minimizes errors during deployment.
- Componentization: Build master components in tools like Figma or Sketch that include variants for empty, half-full, full, and critical states. Include auto-layout properties so the icon resizes correctly when placed in different containers. Document the intended use case for each variant to prevent misuse by junior designers.
- Contextual Testing: Never approve a thermometer icon design without testing it in context. An icon that looks perfect on a white artboard may disappear against a complex photograph or clash with a chart’s axis lines. Test at minimum and maximum sizes to ensure readability. Verify that animations perform smoothly on lower-end devices if the icon is part of a mobile web experience.
- Cultural and Metaphorical Validation: While thermometers are generally universal, verify that the metaphor fits your specific audience. In medical contexts, accuracy is non-negotiable, and stylized icons might undermine perceived professionalism. In financial contexts, ensure "temperature" doesn't imply volatility where stability is desired. Align the visual tone with the emotional expectation of the user task.
- Asset Organization: Maintain a centralized repository for approved thermometer assets. Tag files with metadata including style (outline, filled, duotone), intended use (weather, system, sentiment), and license type. This prevents team members from downloading unlicensed stock vectors or recreating assets that already exist, streamlining the production workflow.
Enhancing Decision-Making Through Visual Clarity
Ultimately, the goal of using thermometer temperature icons is to facilitate better decision-making. When implemented correctly, they reduce the time required to assess a situation. In business intelligence dashboards, they allow managers to scan dozens of KPIs in seconds, identifying outliers that require attention. In consumer apps, they guide users toward desired actions, such as completing a profile or adjusting a setting, by providing satisfying visual feedback.
However, clarity must be balanced with precision. There is a risk of oversimplification when relying too heavily on iconic representation. A thermometer showing 80% capacity communicates urgency, but it does not explain why the system is stressed. Therefore, thermometer temperature icons should always be paired with drill-down capabilities or supplementary text. They serve as the entry point to information, not the entirety of it. Professionals must resist the urge to let aesthetics override utility. A beautifully animated thermometer that misrepresents data is worse than a plain text label.
For educators and content creators, these icons also serve as pacing tools. In video content or slide decks, a rising thermometer can signal a transition to advanced topics or a summary of key takeaways. This visual cue helps structure the learning experience, keeping the audience oriented within the content flow. Similarly, in personal productivity systems, using a thermometer to track habit streaks or focus sessions leverages the psychological principle of visualization to maintain motivation. Seeing progress "heat up" provides a tangible sense of accomplishment that abstract checklists often lack.
Long-Term Maintenance and Evolution
Visual languages evolve, and thermometer temperature icons are no exception. What looks modern today may appear dated in three years. Establish a review cadence for your iconography. Analyze user feedback and interaction metrics to determine if the icons are being understood as intended. Are users clicking on thermometers expecting interactivity when they are static? Are support tickets mentioning confusion about status indicators? Use this qualitative data to refine your assets.
Additionally, consider the scalability of your icon set as new features are added. If you introduce a new metric that doesn't fit the temperature metaphor, forcing it into a thermometer shape creates semantic noise. Be willing to retire or replace icons that no longer serve the workflow. Maintain documentation that explains the rationale behind icon choices, preserving institutional knowledge even as team members change. This long-term perspective transforms thermometer temperature icons from disposable graphics into enduring elements of a robust communication infrastructure.
By approaching thermometer temperature icons with the same rigor applied to code, copy, and strategy, professionals can unlock their full potential. They become powerful tools for synthesis, guiding users through complexity with elegance and efficiency. Whether optimizing a conversion funnel, monitoring industrial equipment, or teaching a new concept, the disciplined application of these visual metaphors enhances understanding and drives meaningful outcomes. The difference between amateur and professional execution lies not in the icon itself, but in the thoughtful process surrounding its selection, integration, and maintenance.